Getting started
Previously I have written about building and debugging using Visual Studio and the VisualGDB add-on for windows.
This time around I have been able to get the Visual Studio Code – a free and opensource IDE – working with OpenOCD and the GNU ARM tool chain. First step is to download and install the necessary parts.
- Visual Studio Code – download
- OpenOCD – download
- GNU ARM tool chain – instructions | download
For this article you will notice that the directories I utilise are:
c:\cygwin\bin
c:\dev\openocd\bin
c:\dev\gcc-arm-6.2\bin
c:\source\flight\betaflight
These will all need to be changed for your particular installation. Take particular note of what you will need to change in the json configuration files for your particular setup.
Install Visual Studio Code
First install the Visual Studio Code (VSCODE), and then add the cpptools extension (run the command: ext install cpptools in VSCODE). See here for the tools instructions: ms-vscode.cpptools at the MarketPlace. You will then be able to open the Betaflight repository, and browse around the files and they should be nicely formatted and have intellisense.
Making sure you can build
Before we can get the build working within VSCODE you need to make sure that you can build the repository from the windows command line. See the instructions above for the GNU Arm tool chain. Before running make you will need to set the Path environment variable to your toolchain, and cygwin e.g. by running:
set Path=c:\cygwin\bin;d:\dev\gcc-arm-6.2\bin;%Path%
. Please note that in Windows I had to get the case-sensitivity exactly right on the Path name of the environment variable for it to work correctly.
You should then be able to build within that command prompt. Note that if you set the path order incorrectly when you are making a target you will likely get a file not found *.c error in the output. This is due to the find command in windows being used instead of the cygwin one. You have two choices, and either works fine. The first option is to set the path permanently. The second is to simply use the configuration files to specify a new path for the executed process. My recommendation is to not set the path, but use the configuration files. When testing simply run the set command for the current window, if you don’t want to have to do that then go with the first option.
Installing OpenOCD
The second thing to get working is OpenOCD. First make sure that your ST link device is operation, test using the ST Link Utility, you should be able to read the MCU details etc.
Once you know your ST Link is working, then download and install OpenOCD. You can then run it using the following command line from the bin directory:
c:\dev\openocd\bin> openocd.exe
    -s c:/dev/openocd/share/openocd/scripts
    -c "adapter_khz 3000"
    -f interface/stlink-v2.cfg
    -c "transport select hla_swd"
    -f target/stm32f4x.cfg
    -c "gdb_port 50250"
    -c init
    -c "reset init"
    -c "echo **READY**"
You should have **READY** displayed if all is working.

I find the easiest way to set this up at the moment is to create a batch file. You can use the ^ (caret) if you want to separate the parameters onto multiple lines in Windows.
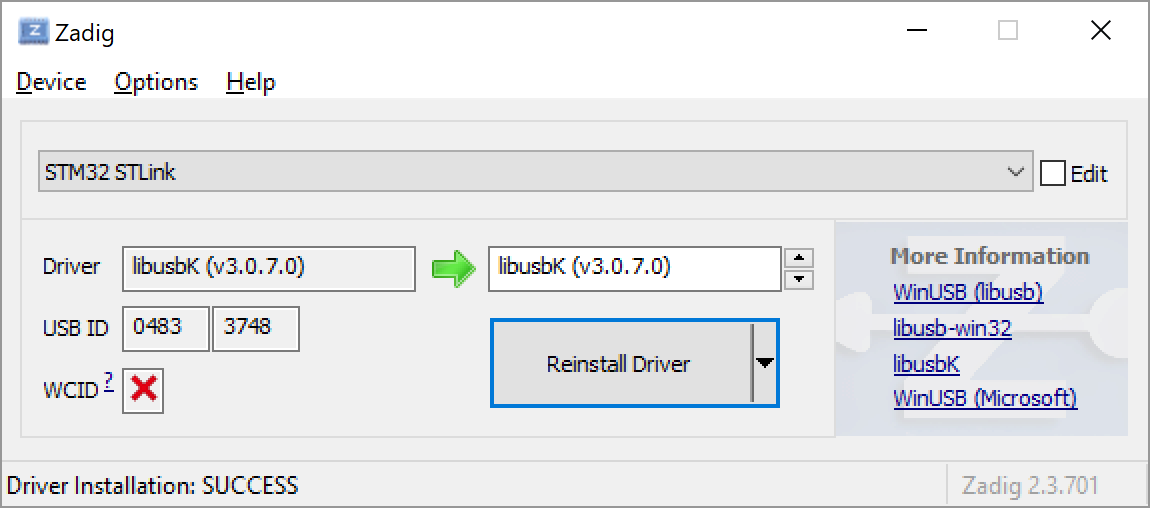
If you get the error libusb_open() failed with LIBUSB_ERROR_NOT_SUPPORTED then you should download the Zadig USB tool, and install the libusbk device driver for the “STM32 Link” device.

For other targets you can use target/stm32f7x.cfg for STM32F7, target/stm32f4x.cfg for STM32F4, target/stm32f3x.cfg for STM32F3, and target/stm32f1x.cfg for STM32F1.
NOTE for STM32F7 only: if you get an error TARGET: stm32f7x.cpu - Not halted then you need to edit the target/stm32f7x.cfg and adjust this line (remove srst_only):
# use hardware reset, connect under reset
reset_config srst_nogate
In addition if you are trying to debug a STM32F722, then you will need to build your own version of OpenOCD with the patches for STM32F722 added as that chip is so new it is not yet in the main branches of OpenOCD. To simplify, you can download my pre-built installation of OpenOCD zipped up.
Setting up VSCODE to perform the build
VSCODE uses the .vscode directory and json files to configure it. This can be created automatically using the menu options in VSCODE.
The first json file needing to be edited will be the tasks.json, select Tasks|Configure Tasks from the VSCODE menu. Here is the configuration I am using:
{
    "version": "2.0.0",
    "type": "process",
    "presentation": {
        "echo": true,
        "reveal": "always",
        "focus": false,
        "panel": "shared"
    },
    "windows": {
        "options": {
            "env": { "Path":"c:\\cygwin\\bin;c:\\dev\\gcc-arm-6.2\\bin;%Path%" }
        }
    },
    "tasks": [
        {
            "taskName": "make BLUEJAYF4",
            "windows": {
                "command": "make.exe",
                "args": [
                    "TARGET=BLUEJAYF4",
                    "DEBUG=GDB"
                ]
            },
            "osx": {
                "command": "make",
                "args": [
                    "TARGET=BLUEJAYF4",
                    "DEBUG=GDB"
                ]
            },
            "group": {
                "kind": "build",
                "isDefault": true
            },
            "problemMatcher": {
                "owner": "cpp",
                "fileLocation": [
                    "relative",
                    "${workspaceRoot}"
                ],
                "pattern": {
                    "regexp": "^(.*):(\\d+):(\\d+):\\s+(warning|error):\\s+(.*)$",
                    "file": 1,
                    "line": 2,
                    "column": 3,
                    "severity": 4,
                    "message": 5
                }
            }
        },
        {
            "taskName": "clean BLUEJAYF4",
            "windows": {
                "command": "make.exe",
                "args": [
                    "TARGET=BLUEJAYF4",
                    "clean"
                ]
            },
            "osx": {
                "command": "make",
                "args": [
                    "TARGET=BLUEJAYF4",
                    "clean"
                ]
            },
            "problemMatcher": []
        }
    ]
}
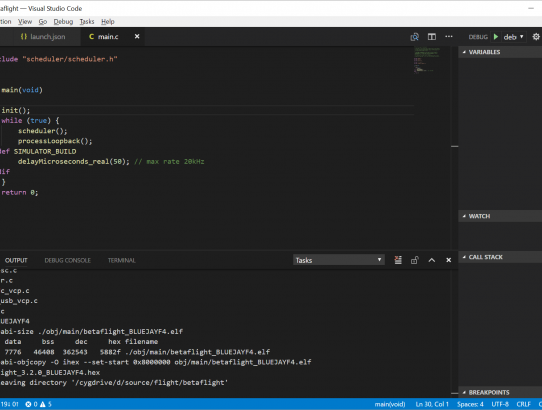
This will allow you to CTRL-SHIFT-B and you should see build information displayed in the terminal output window.
Setting up VSCODE to debug
Select Debug|Open Configurations in VSCODE. You will be presented with the launch.json file. Here is the configuration I am using:
{
    "version": "0.2.0",
    "configurations": [
        {
            "name": "debug BLUEJAYF4",
            "type": "cppdbg",
            "request": "launch",
            "windows": {
                "miDebuggerPath": "c:/dev/gcc-arm-6.2/bin/arm-none-eabi-gdb.exe"
            },
            "targetArchitecture": "arm",
            "program": "c:/source/flight/betaflight/obj/main/betaflight_BLUEJAYF4.elf",
            "setupCommands": [
                { "text": "file c:/source/flight/betaflight/obj/main/betaflight_BLUEJAYF4.elf" },
                { "text": "set remotetimeout 30" },
                { "text": "target remote localhost:50250" },
                { "text": "monitor halt" },
                { "text": "monitor reset init" },
                { "text": "load" },
                { "text": "info target" }
            ],
            "externalConsole": false,
            "cwd": "c:/source/flight/betaflight"
        }
    ]
}
Putting it all together
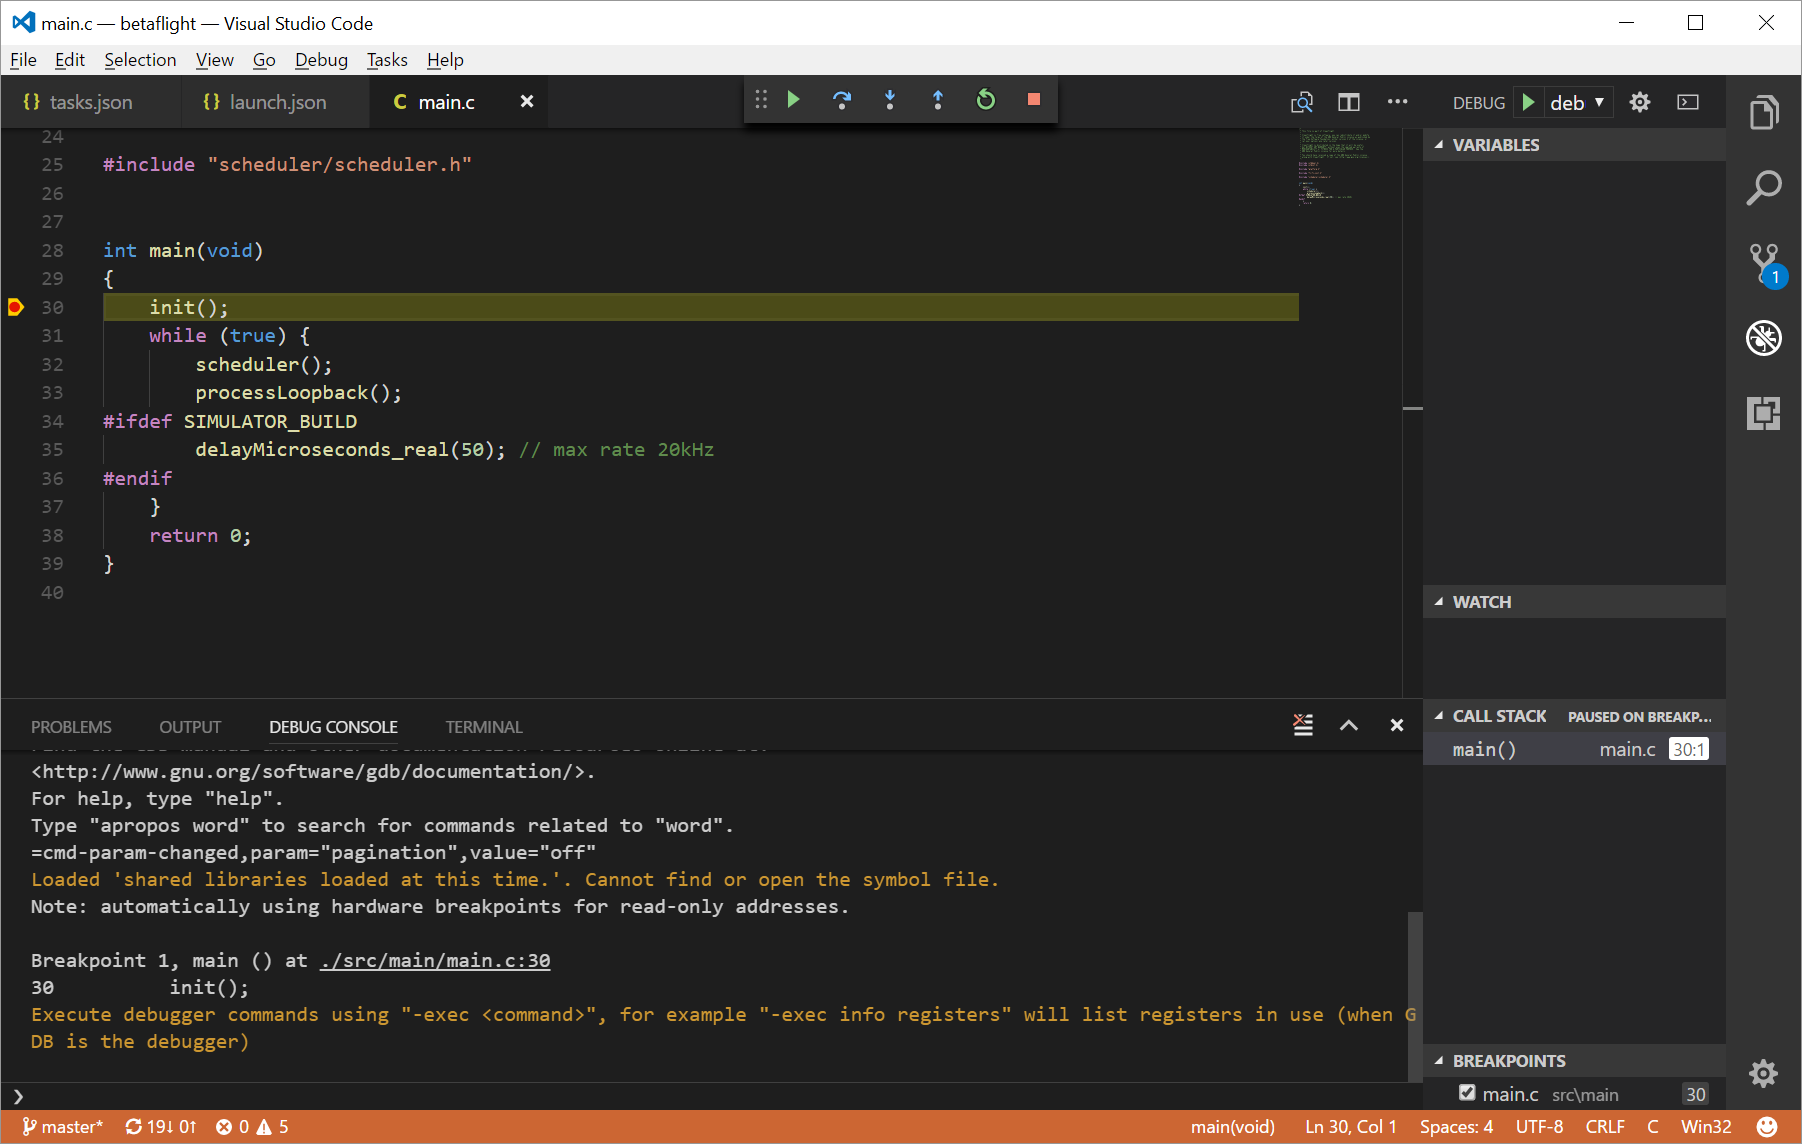
First launch the GDB server in the background, i.e. run OpenOCD as above. You can then run VSCODE and build your target with CTRL-SHIFT-B (or Tasks|Run Task -> make BLUEJAYF4). Once built you can debug using F5 (or Debug|Start Debugging).
In a future article I should have worked out how to automatically start OpenOCD in the background and commence debugging from simply hitting F5. For now though this is working very nicely.

